Breckenridge & Summit County Real Estate Statistics | Breckenridge Associates Real Estate

Summit County Real Estate: A Beacon of Stability in an Uncertain Market

Despite the recent tariffs from the Trump Administration introducing fresh volatility to the equity markets, Summit County real estate continues to stand out as a source of stability and long-term opportunity. While we’re currently seeing rising inventory levels and more selective buyer behavior, our local market remains healthy — and savvy investors are taking notice.

Inventory Is Up — Opportunity Is Knocking

Inventory across Summit County has increased significantly year-over-year, giving buyers more options than they've had in years. But despite the upward trend, supply levels are still within historical norms — a sign of balance, not oversupply.

Breckenridge –…

564 Views, 0 Comments

2024 Summit County Real Estate Market Report

The 2024 Summit County real estate market is currently experiencing two contrasting markets. In one market, Breckenridge is facing record-low inventory levels and unprecedented demand for luxury homes.  The other, broader Summit County market is seeing a different story playout, with rising inventory levels and slowing demand, particularly for properties that appeal to buyers who require financing.

This dual-market dynamic highlights the need to understand each segment's unique characteristics to navigate today's real estate landscape successfully.

Breckenridge: Luxury Market on the Rise

Breckenridge continues to see a boom in luxury home sales, driven by cash buyers looking to diversify their…

1084 Views, 0 Comments

Buying Behavior Shifts as Q3 Ends

Summit County, CO Real Estate Market Performance Q3 2024

The real estate market in Summit County is continuing to normalize toward pre-COVID levels, as we see an emerging re-balance between supply and demand. With an increase in available properties and a consistent stream of price reductions, many buyers are more patient than they have been since the 2016-2019 period.

While the number of properties on the market has increased, the number of units sold is trending back toward the record lows Summit County experienced during the post-recession era of 2009-2012. Yet, despite these shifts, property prices—except for vacant land—continue to reach all-time highs.

A Unique Market Trend: Higher Prices, Lower Demand

Economically, the combination of higher supply,…

1022 Views, 0 Comments

Breckenridge Market: Record Valuations Persist As Signs of Balance Develop

Breckenridge Real Estate Market Appreciation Stats 2024 Q2

The real estate market in Breckenridge continues to show strength, with most property types closing at record valuation levels. Yet indicators are suggesting a shift towards a more balanced market, with increasing inventory and decreasing buyer showings.

A Detailed Breakdown of the Breckenridge Market Performance:

Breckenridge Single Family Homes: Values are up by 16.59% year-to-date (YTD) compared to 2023, with an average sold price of $2,777,979. Properties are selling at 96% of the list price, averaging $791 per square foot (SF), and spending 72 days on the market (DOM).

Breckenridge Townhomes: The market has slightly leveled off, down by 1.82% YTD compared…

1313 Views, 0 Comments

Q1 Brings Positive Growth Across All Property Types

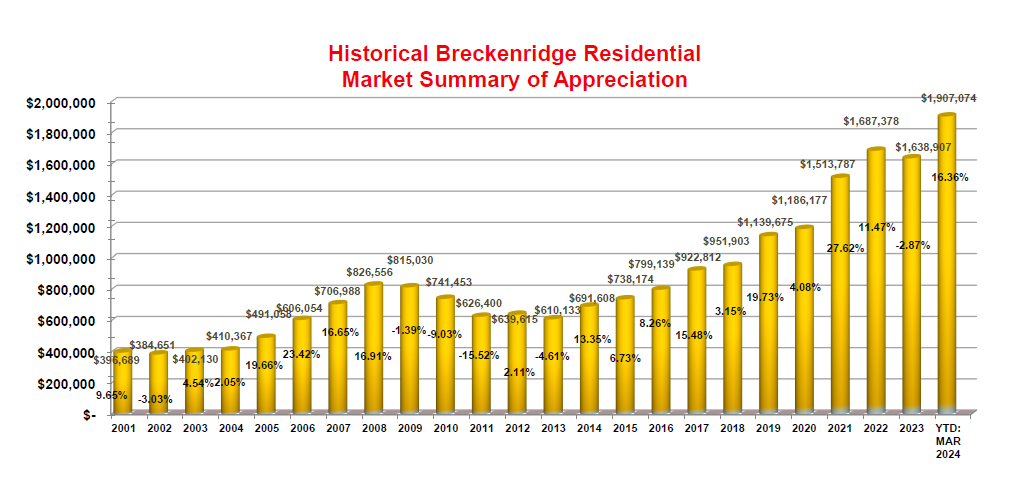
The first quarter of 2024 has seen an upward trend across all property types. The ongoing all-time high valuations in the equity markets, coupled with positive "soft landing" national news and historically low inventory levels have continued to drive growth in our resort market.

Impact by Property Type in Breckenridge:

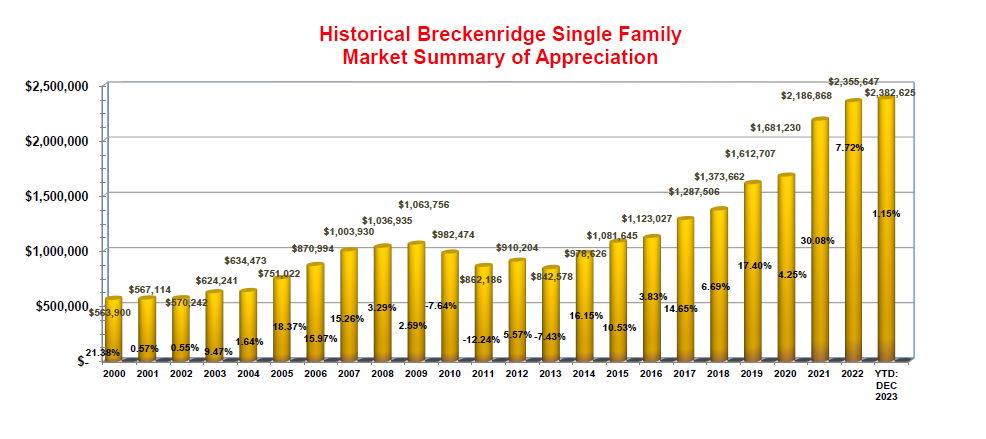
Single Family Homes Up 15.83% YTD

The average sold price for Single-Family Homes has increased to $2,759,808, representing a 15.83% appreciation over 2023. This property type is selling on average at 95% of the list price, with an average price per square foot of $749, and an average days on market of 102.

Townhomes Up 14.08% YTD

Townhomes have seen a 14.08% increase…

1347 Views, 0 Comments

Breckenridge’s Market Remained Steady Throughout 2023

Breckenridge Market Stats for Single Family Homes 2023

Breckenridge's residential market remained stable throughout 2023. Single Family Home Prices in Breckenridge ended the year up 1.15% versus a 7.72% increase in 2022. The relatively stable pricing levels are the result of continued low inventory levels. 2023 ended with Breckenridge’s inventory levels at 124 active listings, down from the 8-year average of 148 active listings. However, inventory is still up from Covid levels which were 85 active listings at the end of 2020 and 54 active listings at the end of 2021. As inventory continues to normalize back to pre-Covid levels, so does the average days on market; now trending back towards the more typical 75-90 days.

Vacant Land and Townhomes…

1771 Views, 0 Comments

Interest Rates Begin to Decrease Heading Into 2024

2023 Interest Rates Double Over Previous Years

Interest rates for 2023 were the highest the United States has seen since the 1990’s. We entered 2023 with interest rates above 6% only to see rates soar to above 7% in late October – more than double their historic lows seen in 2020 and 2021.

As mortgage interest rates climbed this past year, the Breckenridge home buying market adjusted to current market conditions with a historically low inventory. Demand to own in Breckenridge and the surrounding areas of Summit County, however, remained strong leading to an uptick in the number of cash deals.

Interest Rates Begin to Drop as 2023 Comes to an End

We’re finally seeing mortgage interest rates…

754 Views, 0 Comments

2023 3rd Quarter Real Estate Market Statistics

With the stunning fall weather continuing to bring in visitors into our quaint and lively town, it is our pleasure to report that the real estate market here in Breckenridge and across Summit County remains “balanced”.

Low Inventory Levels Impact Supply-Demand Dynamics

Inventory levels remain historically low at 548 county-wide year to date compared to the 10-year average of 746. Correspondingly, the number of Properties Sold county-wide also remains historically low at 1,177 year to date versus a 10-year average of 1,610. Current supply-demand dynamics have led to a slight decrease of 2.58% in the Average Sold Prices for All Property Types across all areas of the county. While Days on Market remains…

695 Views, 0 Comments

2023 2nd Quarter Real Estate Market Statistics

The Breckenridge condominium market continues to show signs of strength with the Average Sold Price up 7.64% YTD versus 2022. Conversely, the Breckenridge single family home market continues to soften with Average Sold Prices down 6.84% YTD versus 2022.

Market Conditions Show Impact of Short-Term Rental Regulations in Breckenridge

With a higher number of condominiums located in the Resort Zone and Zone 1, these properties continue to benefit from a larger buyer pool that wants rental income to help offset ownership costs. There are only a select few neighborhoods left where buyers can still obtain a Short-Term Rental License for single family homes, causing that market segment to moderate.

This…

614 Views, 0 Comments

2023 Quarter 1: A Recalibrating Market

So far, 2023 has seen a record low number of sales across Summit County with 229 sales in Q1. 2009 was the last time when the number of sales county-wide for the year was below 1,000. However, average sold prices for all property types are approximately double those of 2009. Once again affirming that the Summit County market remains a haven for investable assets while most markets around the country experience turbulence.

2023 Quarter 1 Housing Market Stats for Summit County, CO

Low Inventory, High Demand

While the number of sales across the county has decreased, the average sold price for all property types in Breckenridge has continued to appreciate throughout Q1 at 6.72%. The average sold price for Breckenridge condos is up 13.94% versus 2022, while the…

773 Views, 0 Comments