Buying Summit Association of Realtors Market Reports
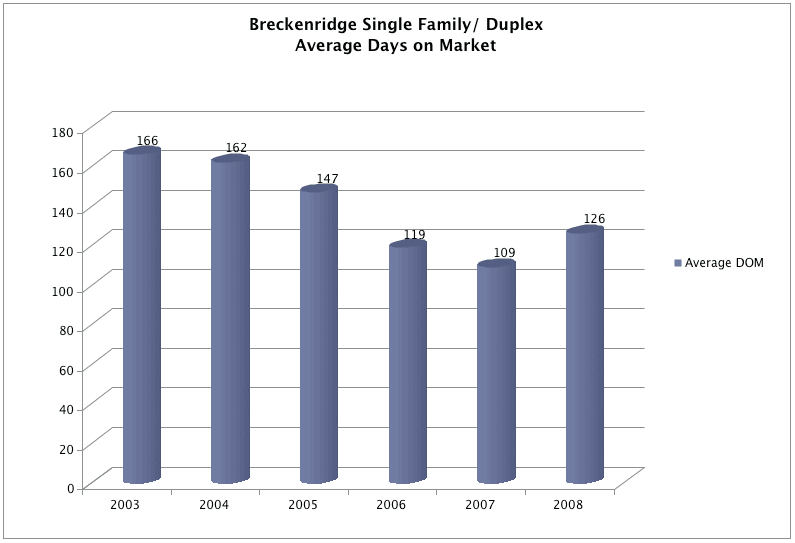
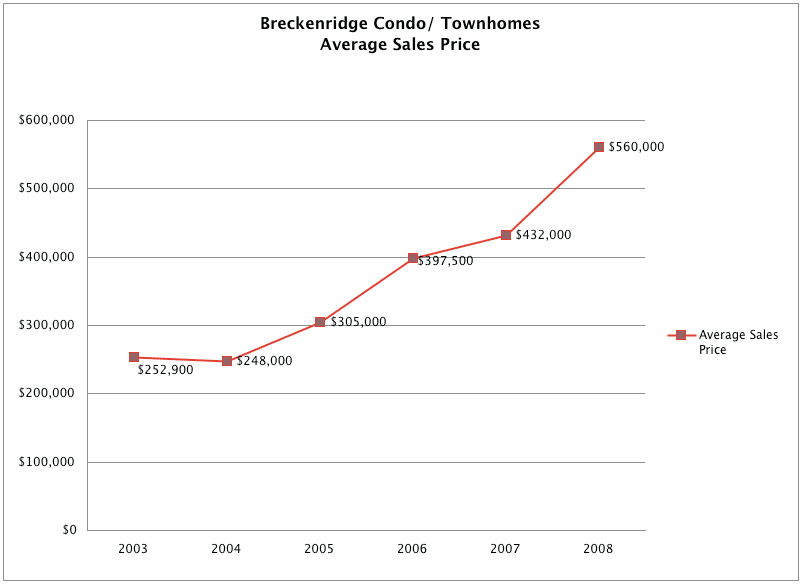
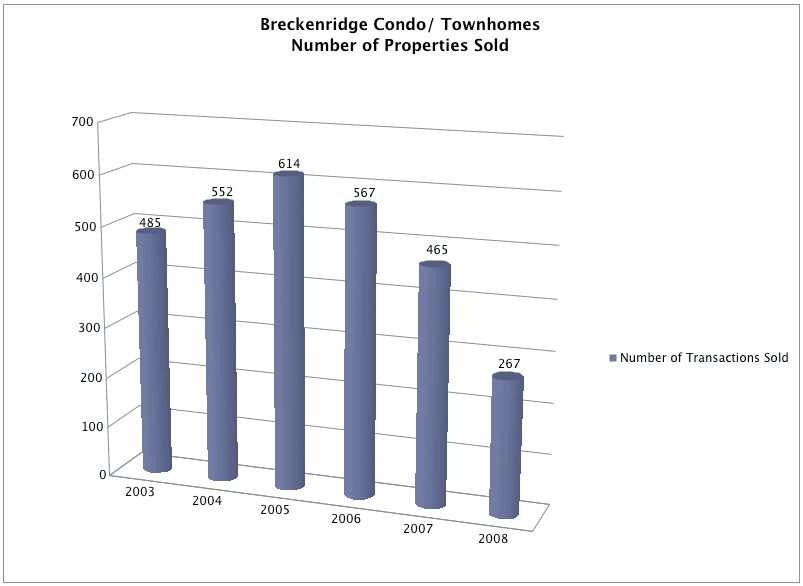
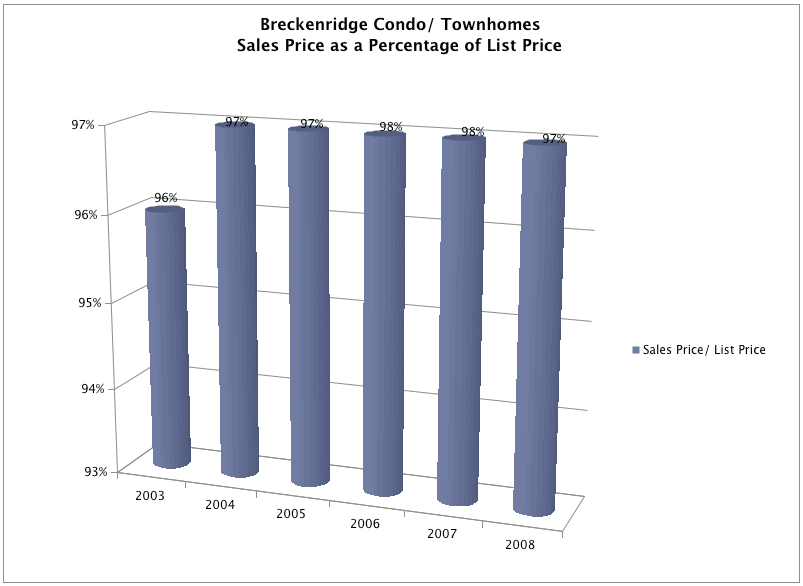
The graphs in this section are based on data pulled directly from the Summit County MLS data and compare annual statistics from 2003 through 2008. Statistics are reported by grouping together Single Family Residences and Duplexes, and in a separate grouping are Condos and Townhomes. Areas reported are broken out into Breckenridge and Summit County.
It is a great time to buy in Breckenridge and surrounding areas. 2009 is one of those rare periods in Summit County where buyers can readily benefit from a slow-down in the expected appreciation rates, due to the turmoil in the national economy. Please contact your BARE Partner/Broker for greater detail on the graphs shown here or to learn more about Breckenridge and Summit County.
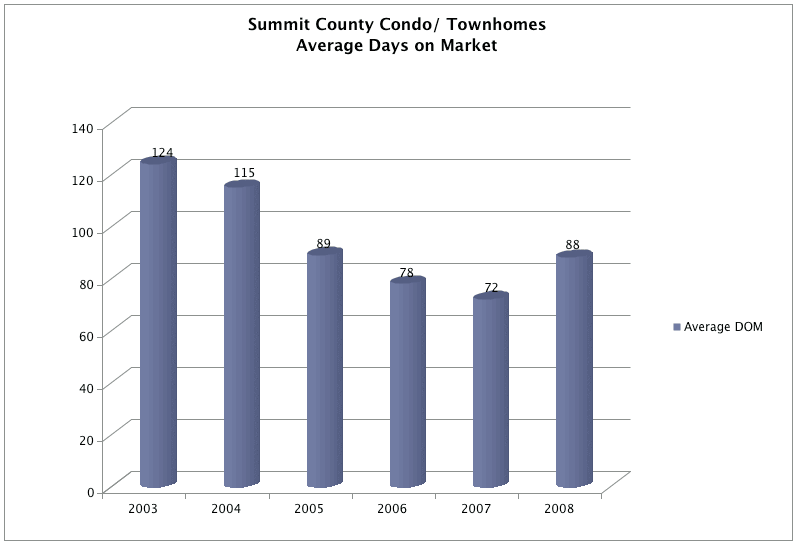
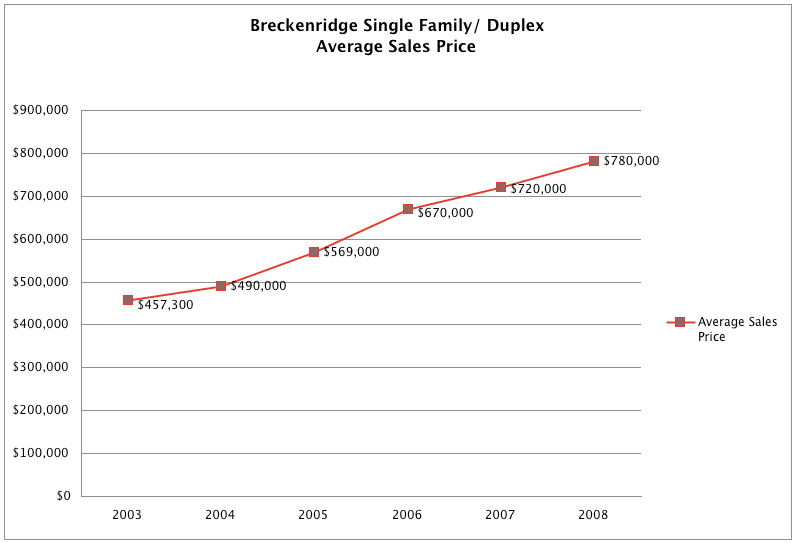
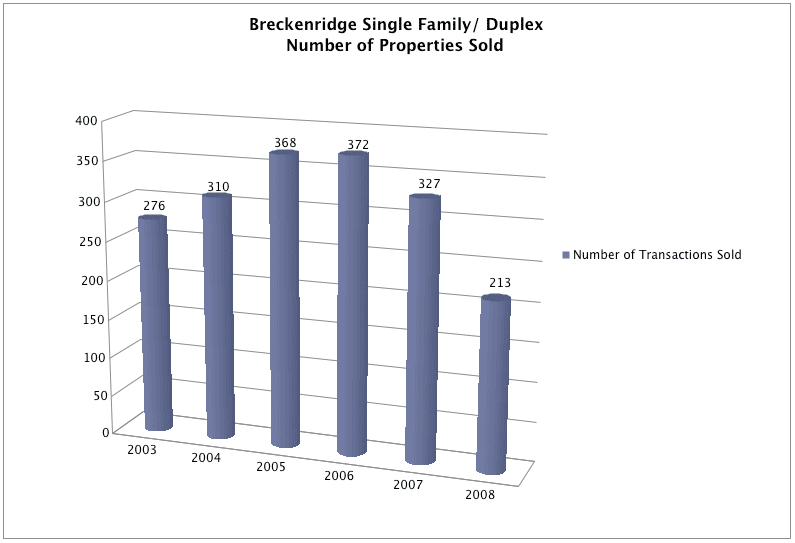
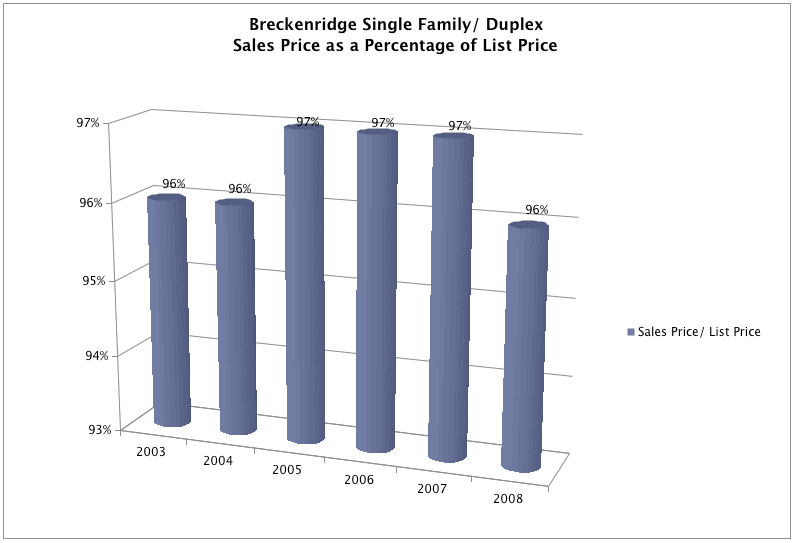
The following graphs are available: Breckenridge Single Family Residences & Duplexes, Average Sales Price, Number Of Properties Sold, Average Sold Price Per Square Foot, Sales Price As A Percentage of List Price, Days On Market. And also these for Breckenridge Condos & Townhomes: Average Sales Price, Number Of Properties Sold, Average Sold Price Per Square Foot, Sales Price As A Percentage of List Price, Days On Market. Similar graphs are available for the entire county, by catagory. Summit County Single Family Residences & Duplexes: Average Sales Price, Number Of Properties Sold, Average Sold Price Per Square Foot, Sales Price As A Percentage of List Price, Days On Market, and also Summit County Condos & Townhomes graphs: Average Sales Price, Number Of Properties Sold, Average Sold Price Per Square Foot, Sales Price As A Percentage of List Price, and Days On Market.
Breckenridge Single Family Residences & Duplexes
Average Sales Price
Number Of Properties Sold
Average Sold Price Per Square Foot

Sales Price As A Percentage of List Price
Days On Market
Breckenridge Condos & Townhomes
Average Sales Price
Number Of Properties Sold
Average Sold Price Per Square Foot

Sales Price As A Percentage of List Price
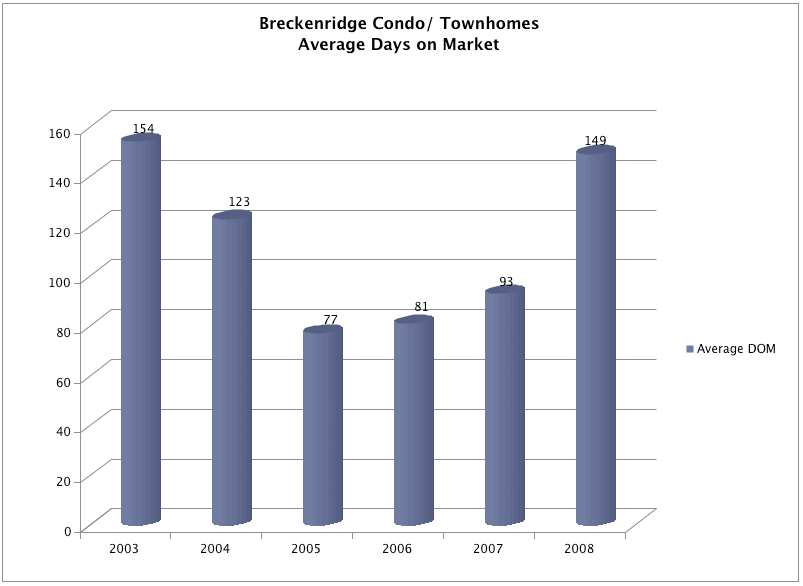
Days On Market
Summit County Single Family Residences & Duplexes
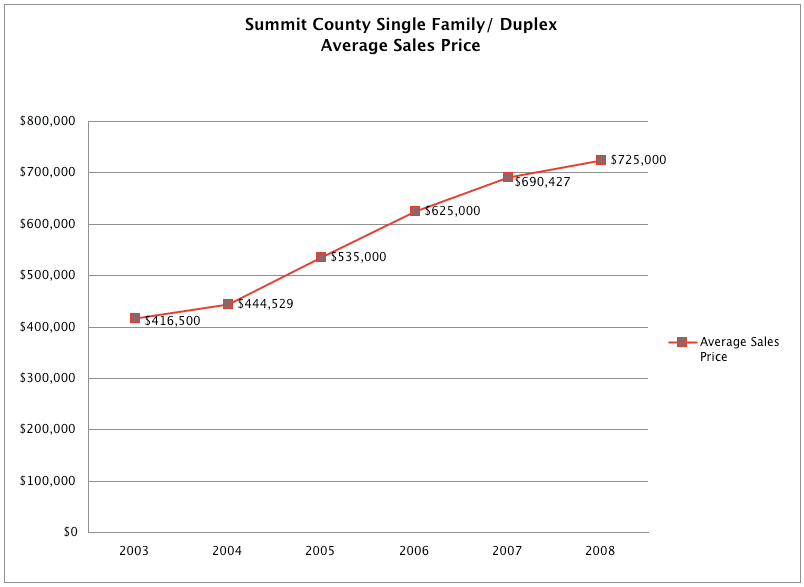
Average Sales Price
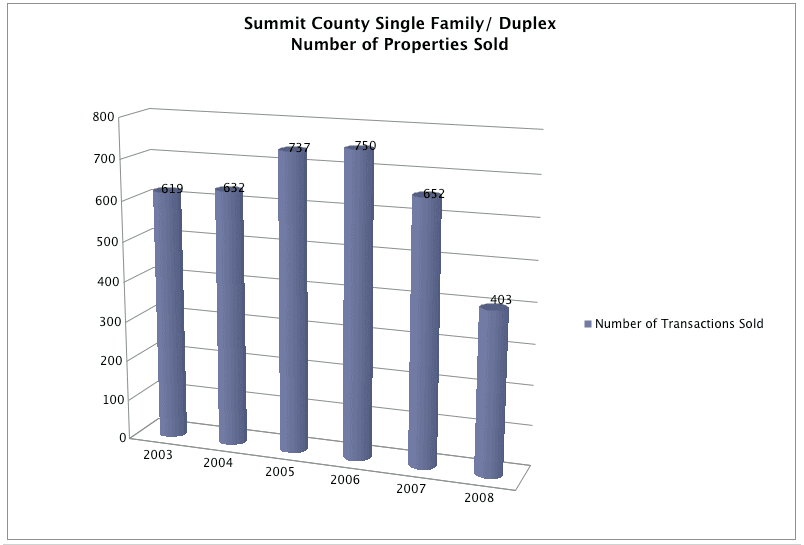
Number Of Properties Sold
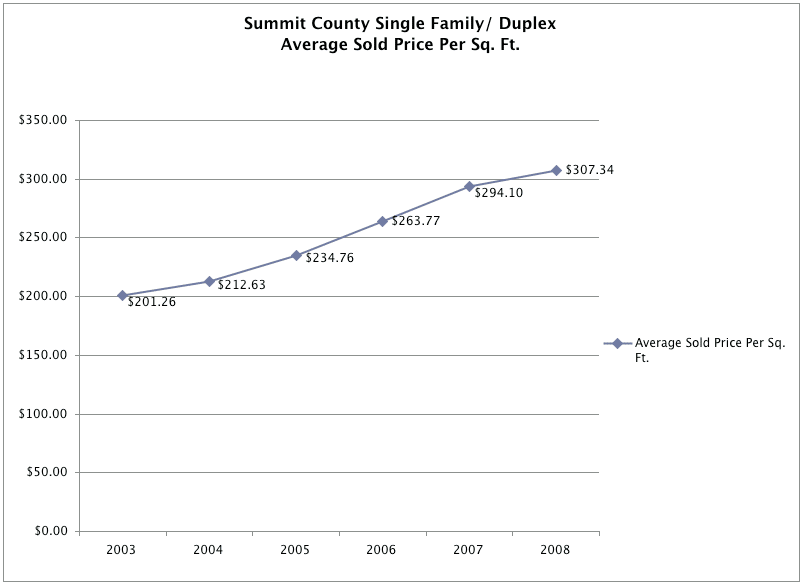
Average Sold Price Per Square Foot
Sales Price As A Percentage of List Price

Days On Market

Summit County Condos & Townhomes
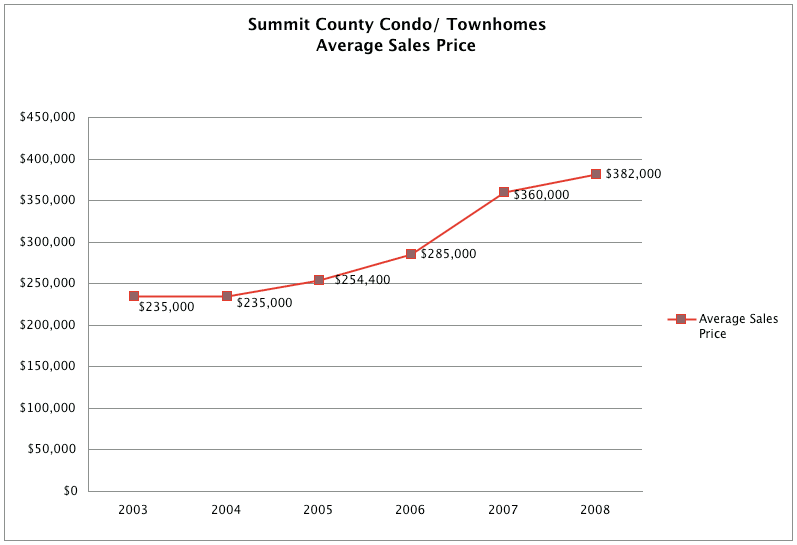
Average Sales Price
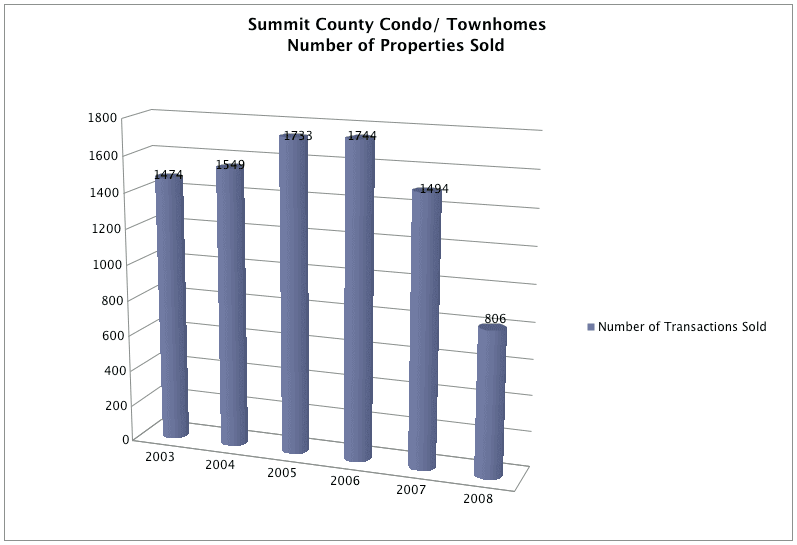
Number Of Properties Sold
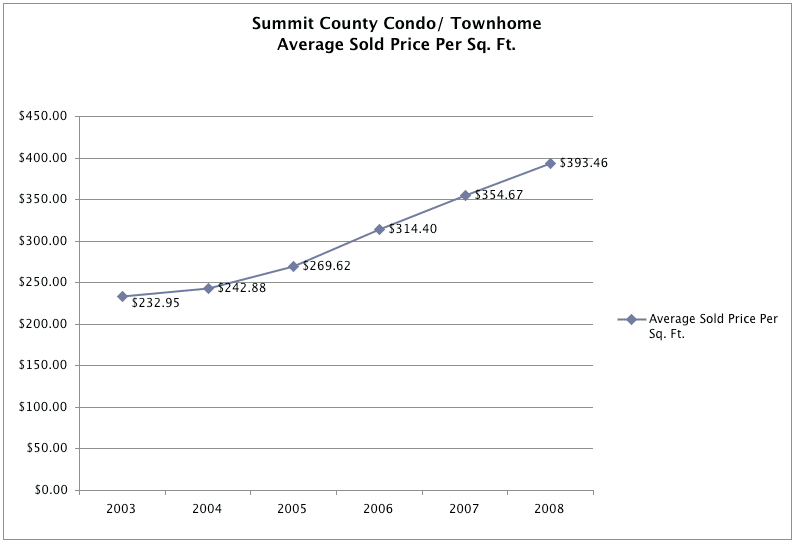
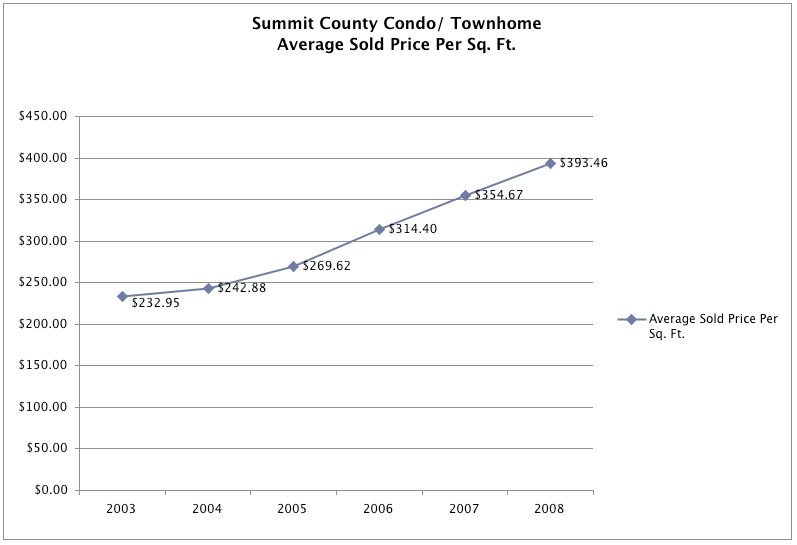
Average Sold Price Per Square Foot
Sales Price As A Percentage of List Price
Days On Market
