Breckenridge & Summit County Real Estate Statistics | Breckenridge Associates Real Estate

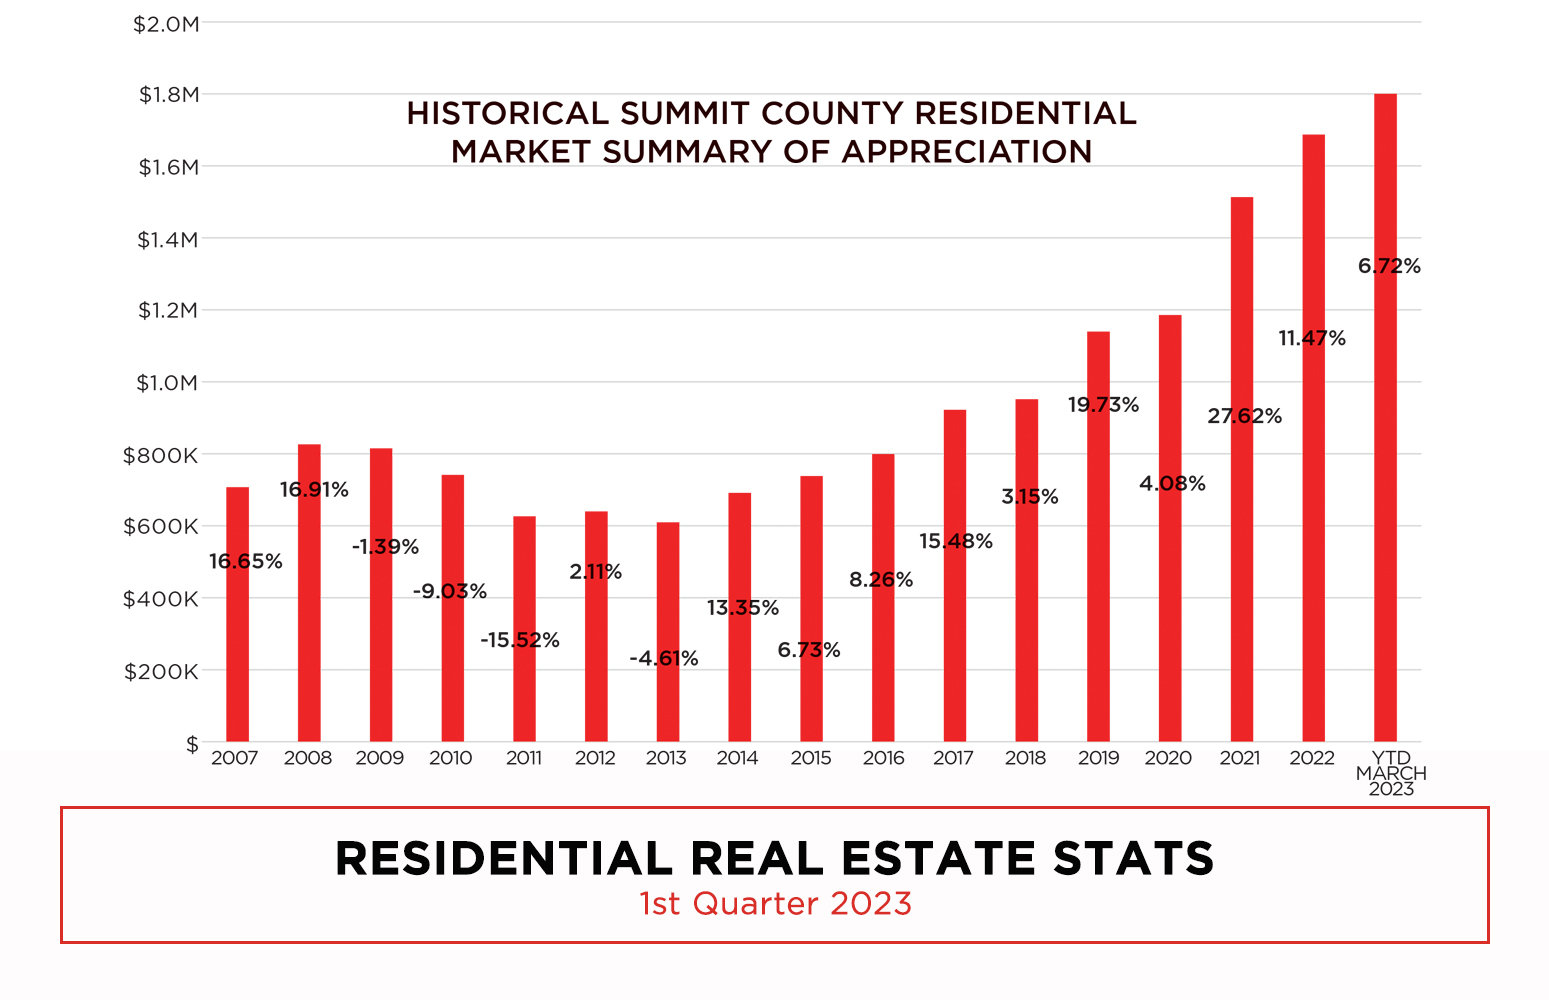
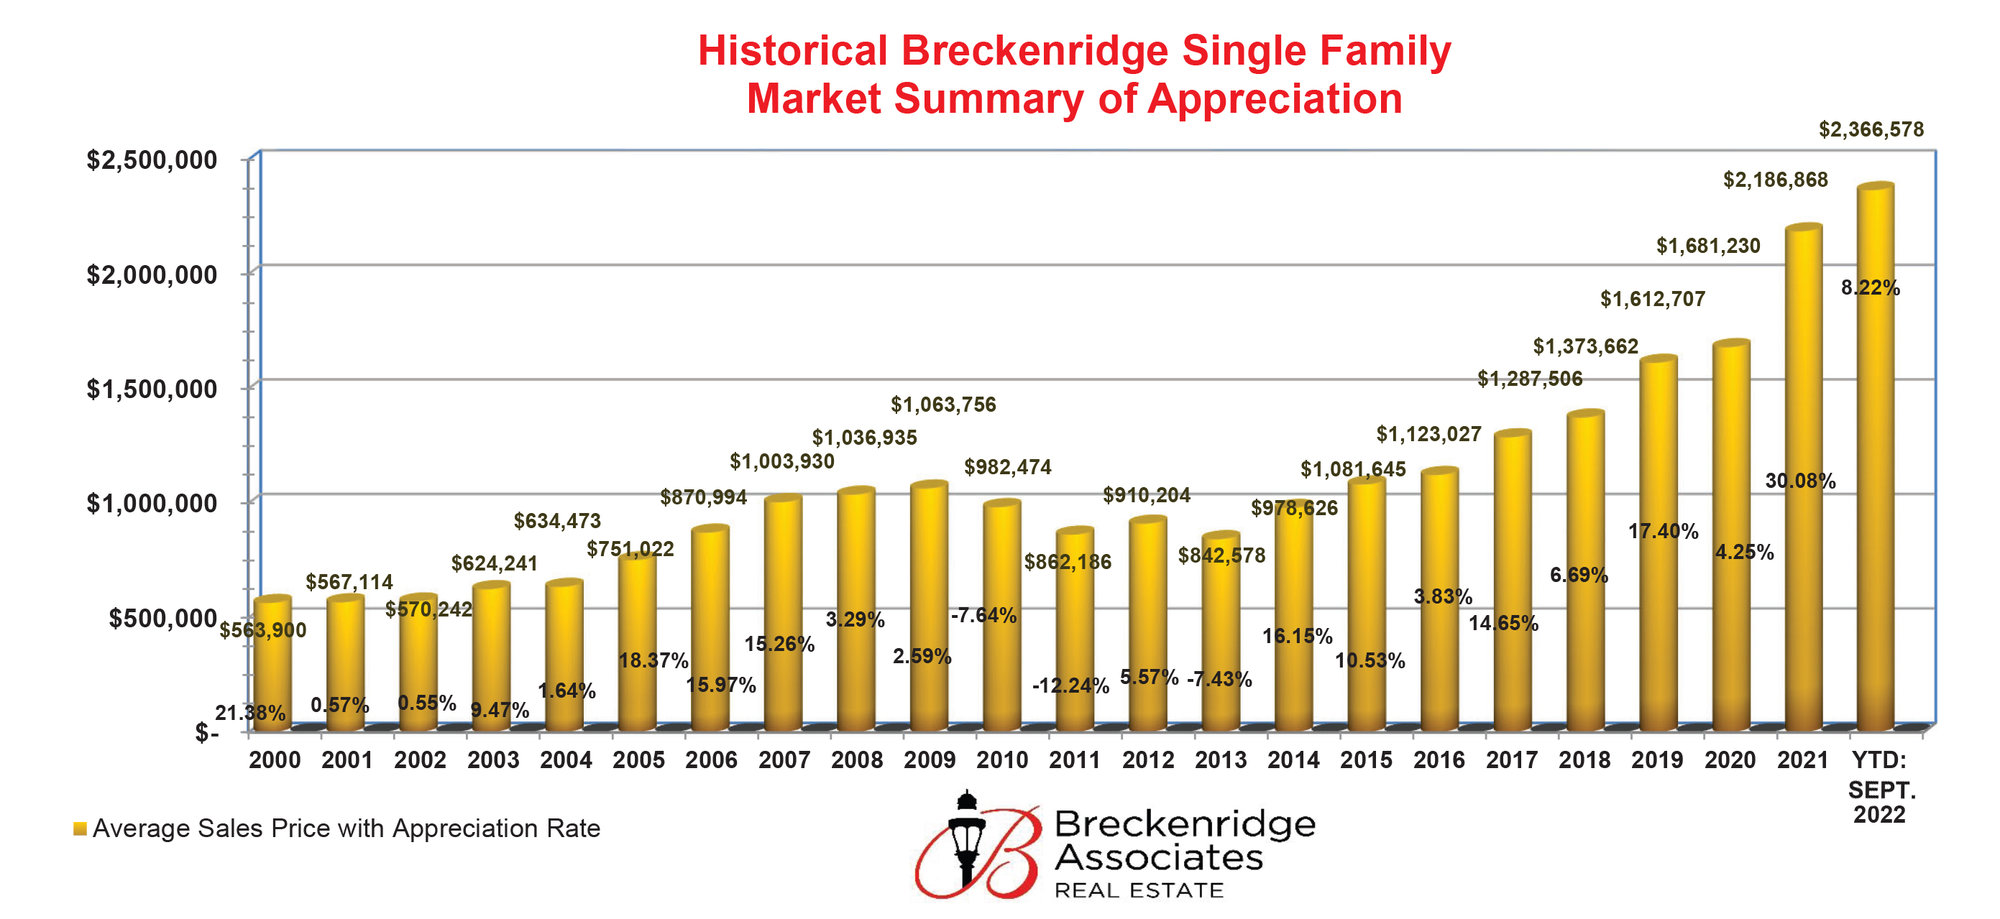
Breckenridge’s Market Remained Steady Throughout 2023

Breckenridge Market Stats for Single Family Homes 2023

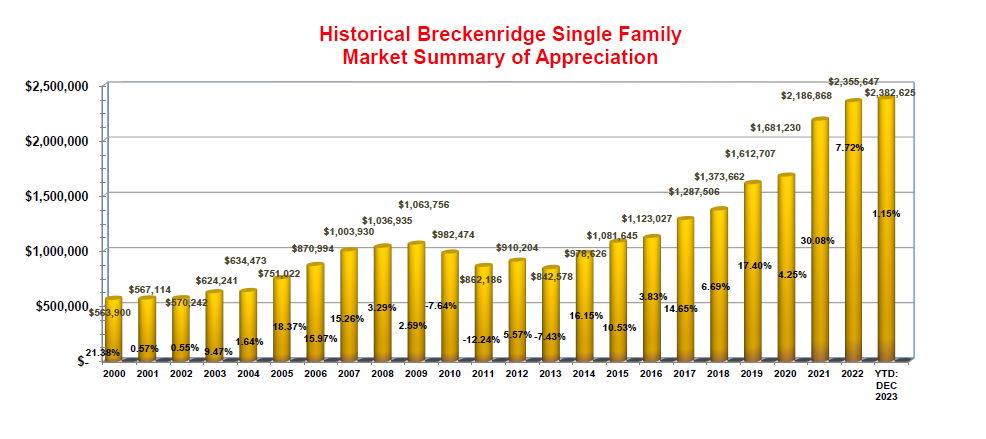
Breckenridge's residential market remained stable throughout 2023. Single Family Home Prices in Breckenridge ended the year up 1.15% versus a 7.72% increase in 2022. The relatively stable pricing levels are the result of continued low inventory levels. 2023 ended with Breckenridge’s inventory levels at 124 active listings, down from the 8-year average of 148 active listings. However, inventory is still up from Covid levels which were 85 active listings at the end of 2020 and 54 active listings at the end of 2021. As inventory continues to normalize back to pre-Covid levels, so does the average days on market; now trending back towards the more typical 75-90 days.

Vacant Land and Townhomes…

1156 Views, 0 Comments

Interest Rates Begin to Decrease Heading Into 2024

2023 Interest Rates Double Over Previous Years

Interest rates for 2023 were the highest the United States has seen since the 1990’s. We entered 2023 with interest rates above 6% only to see rates soar to above 7% in late October – more than double their historic lows seen in 2020 and 2021.

As mortgage interest rates climbed this past year, the Breckenridge home buying market adjusted to current market conditions with a historically low inventory. Demand to own in Breckenridge and the surrounding areas of Summit County, however, remained strong leading to an uptick in the number of cash deals.

Interest Rates Begin to Drop as 2023 Comes to an End

We’re finally seeing mortgage interest rates…

470 Views, 0 Comments

2023 3rd Quarter Real Estate Market Statistics

With the stunning fall weather continuing to bring in visitors into our quaint and lively town, it is our pleasure to report that the real estate market here in Breckenridge and across Summit County remains “balanced”.

Low Inventory Levels Impact Supply-Demand Dynamics

Inventory levels remain historically low at 548 county-wide year to date compared to the 10-year average of 746. Correspondingly, the number of Properties Sold county-wide also remains historically low at 1,177 year to date versus a 10-year average of 1,610. Current supply-demand dynamics have led to a slight decrease of 2.58% in the Average Sold Prices for All Property Types across all areas of the county. While Days on Market remains…

477 Views, 0 Comments

2023 2nd Quarter Real Estate Market Statistics

The Breckenridge condominium market continues to show signs of strength with the Average Sold Price up 7.64% YTD versus 2022. Conversely, the Breckenridge single family home market continues to soften with Average Sold Prices down 6.84% YTD versus 2022.

Market Conditions Show Impact of Short-Term Rental Regulations in Breckenridge

With a higher number of condominiums located in the Resort Zone and Zone 1, these properties continue to benefit from a larger buyer pool that wants rental income to help offset ownership costs. There are only a select few neighborhoods left where buyers can still obtain a Short-Term Rental License for single family homes, causing that market segment to moderate.

This…

398 Views, 0 Comments

2023 Quarter 1: A Recalibrating Market

So far, 2023 has seen a record low number of sales across Summit County with 229 sales in Q1. 2009 was the last time when the number of sales county-wide for the year was below 1,000. However, average sold prices for all property types are approximately double those of 2009. Once again affirming that the Summit County market remains a haven for investable assets while most markets around the country experience turbulence.

2023 Quarter 1 Housing Market Stats for Summit County, CO

Low Inventory, High Demand

While the number of sales across the county has decreased, the average sold price for all property types in Breckenridge has continued to appreciate throughout Q1 at 6.72%. The average sold price for Breckenridge condos is up 13.94% versus 2022, while the…

540 Views, 0 Comments

Summit County End of Year Market Stats for 2022

2021 will go down as one of the strongest real estate years ever recorded, with average sold prices county wide appreciating 25.15%. 2022 will go down as the year that the Summit County real estate market began to normalize back towards more balanced, pre-Covid conditions.

2022 recorded a 13.63% appreciation in average sold prices for all of Summit County compared to 2021. The bulk of that appreciation occurred within the first two quarters of 2022. Average single family sold prices set all-time records at $2,829,617 in Q1 of 2022 for Breckenridge. The average single family sold prices peaked at $2,994,000 in Q2 for Keystone.

Since Q2 of 2022, average sold prices have been under pressure in most…

590 Views, 0 Comments

Historical Breckenridge Single Family Market Appreciation Report

The real estate market is “normalizing”… What exactly does that mean for our unique Summit County market?

Year to date, the number of real estate sales for 2022 are down 42.31 % in Breckenridge and 32.64% for all of Summit County as compared to the record-breaking sales of 2021. However, bubbles have not burst, as the saying goes, but rather shifted back to a steady yet measurable level similar to what was recorded prior to the COVID 19 Pandemic.

Despite this shift to “normalization,” inventory is still low. The number of active listings in Summit County is 488 versus the mean average of 922 for the third quarters of 2013-2019.

The average price for a single-family home remains…

711 Views, 0 Comments


The Breckenridge Associates Summer 2022 Source Magazine is now available in both digital and hard copies. 

Take a look and we're sure you'll agree this edition is the best Source we've ever published and one you'll want to keep on hand for future reference.

Our Source Magazines always include new listings, new construction, and the most recent Summit County real estate statistics.

The Summit County lifestyle articles for Summer 2022 cover the hot topics such as affordable housing initiatives, kids activities and events, everything dog owners want and need to know, and the most inclusive and up-to-date dining guide for Breckenridge.  

Click on the Source Magazine photo above for the digital version or stop by our Main Street Breckenridge office…

1444 Views, 0 Comments

The end of skyrocketing prices?

As ski season comes to an end, selling season begins! Put the skis away and take out the For Sale signs. If you have been wondering whether to list your Breckenridge or Summit County mountain property, we hope the first quarter Summit County MLS statistics will give you the answer.  

The most significant statistic from the 2022 first quarter report is that residential property sales in Breckenridge are down 42% from end of March 2021. For all of Summit County, sales are down 31%. Inventory is slightly up in both Breckenridge and Summit County. List-to-sales-price ratio remains the same for March 2022 as it was in March 2021 (100%). Summit County inventory peaks June-September once ski season makes its farewell on…

747 Views, 0 Comments

The unexpected boom that occurred in our real estate market in 2020 continued its upward trend into 2021. The overall number of residential properties sold in Breckenridge increased from 798 to 812 while Summit and Park Counties combined saw an increase from 2666 to 2702.

What makes these statistics even more remarkable is that they are coupled with historically low inventory even during the busier selling seasons. More buyers are buying and more sellers are selling. Demand is high and supply is low.

Has anything gone down? Yes- days on market are down! Properties sell so quickly that inventory levels don’t appear to change. 

Is it a great time to sell? Yes! Sellers are seeing huge returns, even on homes recently purchased in the past 12-24…

608 Views, 0 Comments